We have provided tools in the scPlant framework for cross-species integration of single-cell data in matched organs/tissues using one-by-one orthologous genes as anchors. Note that scPlant mainly uses the strategy of canonical correlation analysis (CCA) and reciprocal PCA (RPCA) for data integration as described in Stuart*, Butler* et al, 2019. What’s more, scPlant normalizes each dataset with SCTransform (Hafemeister and Satija, 2019) before integration.
Here, we take 3 toy example data (expression matrix) to demonstrate how to perform a cross-species integration.
dim(example_Ath) # toy example data of Arabidopsis thaliana## [1] 7000 2000
dim(example_Osa) # toy example data of Oryza sativa## [1] 7000 2000
dim(example_Zma) # toy example data of Zea mays## [1] 7000 1000Cross-species integration
Multiple expression matrices can be provided, as long as the
parameter species is specified.
integratedObj <- crossSpecies_integrate(matrices = list(example_Ath, example_Osa, example_Zma),
                                        species = c('Ath', 'Osa', 'Zma'), resolution = 0.5)
We finally got an integrated Seurat object
integratedObj, which we can perform downstream analysis
on.
Seurat::DefaultAssay(integratedObj) <- 'SCT'
dim(integratedObj)
## [1] 4190 4578Visualize integration result
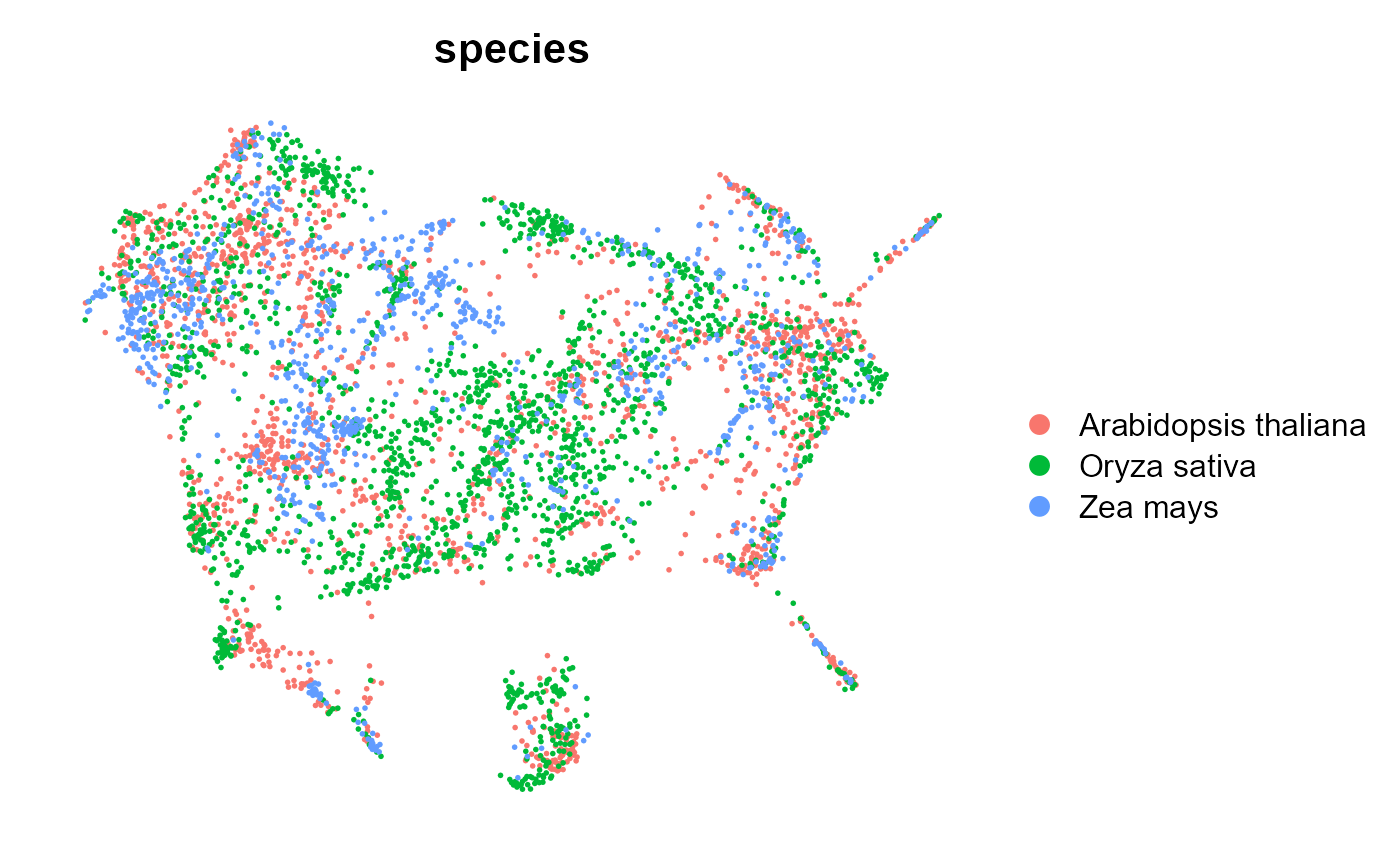
Seurat::DimPlot(integratedObj, reduction = "umap", group.by = "seurat_clusters", label = F,
                repel = TRUE, split.by = "species") + Seurat::NoAxes()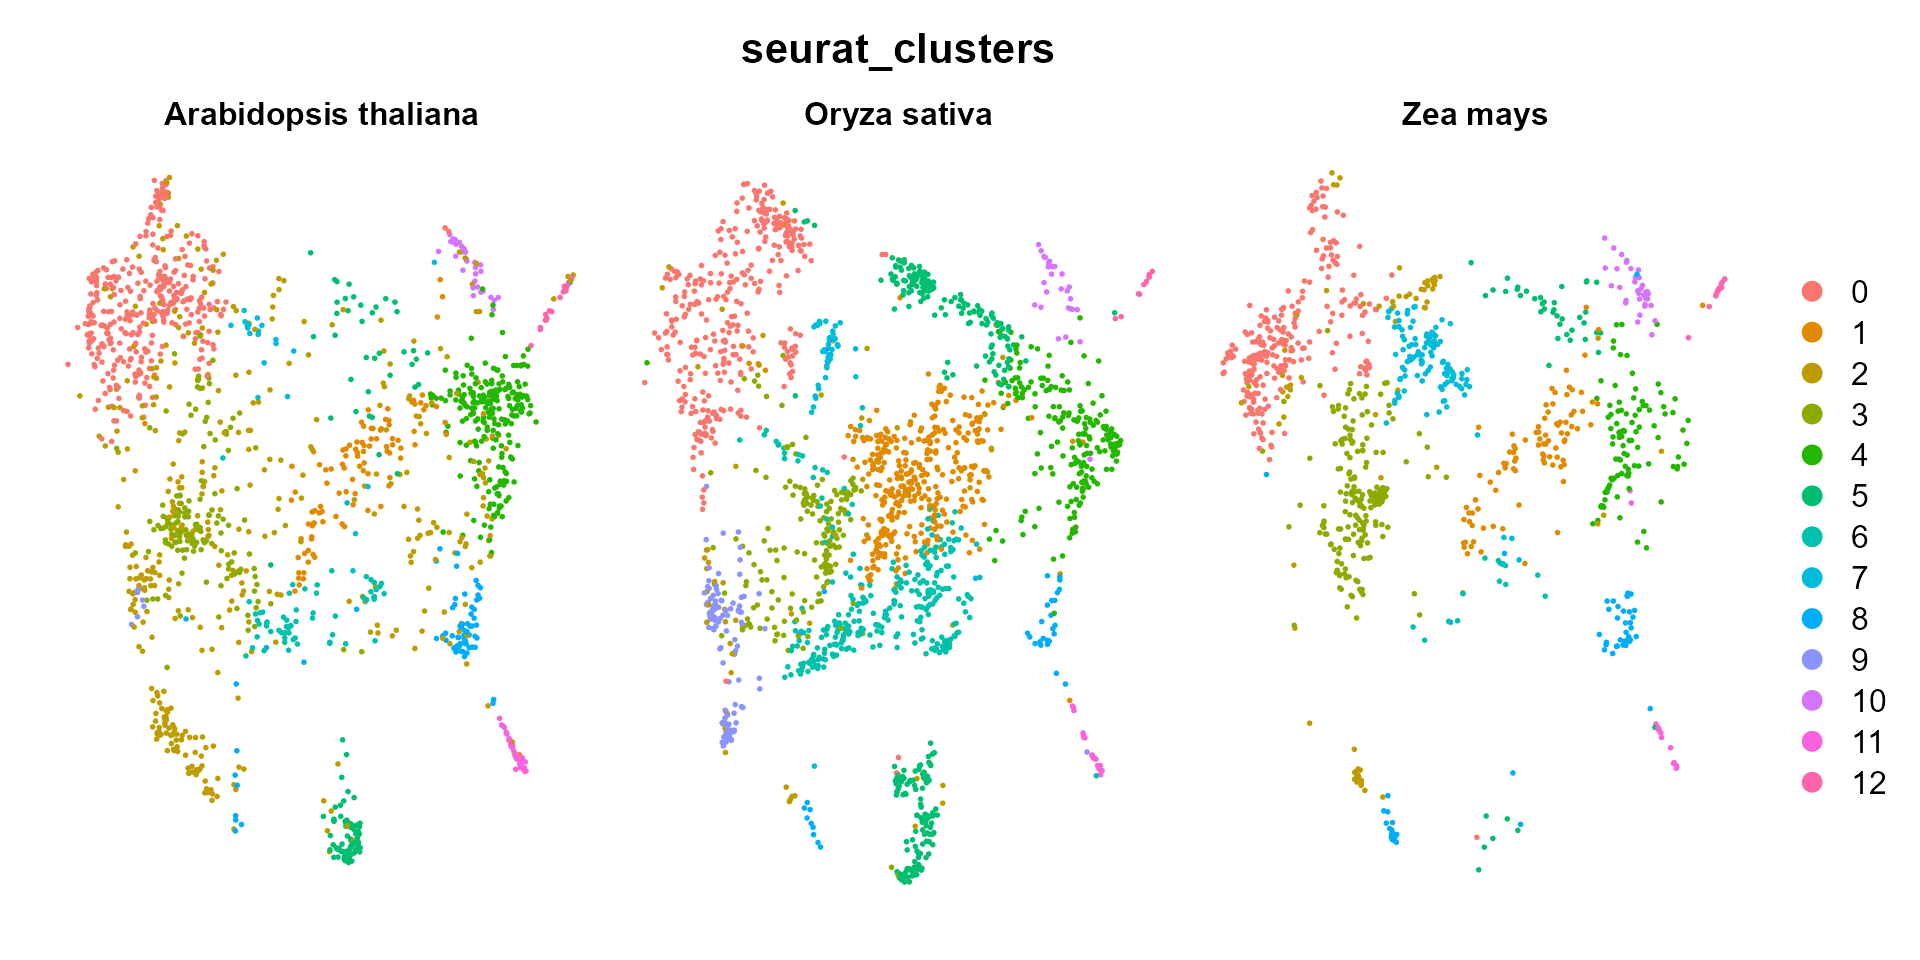
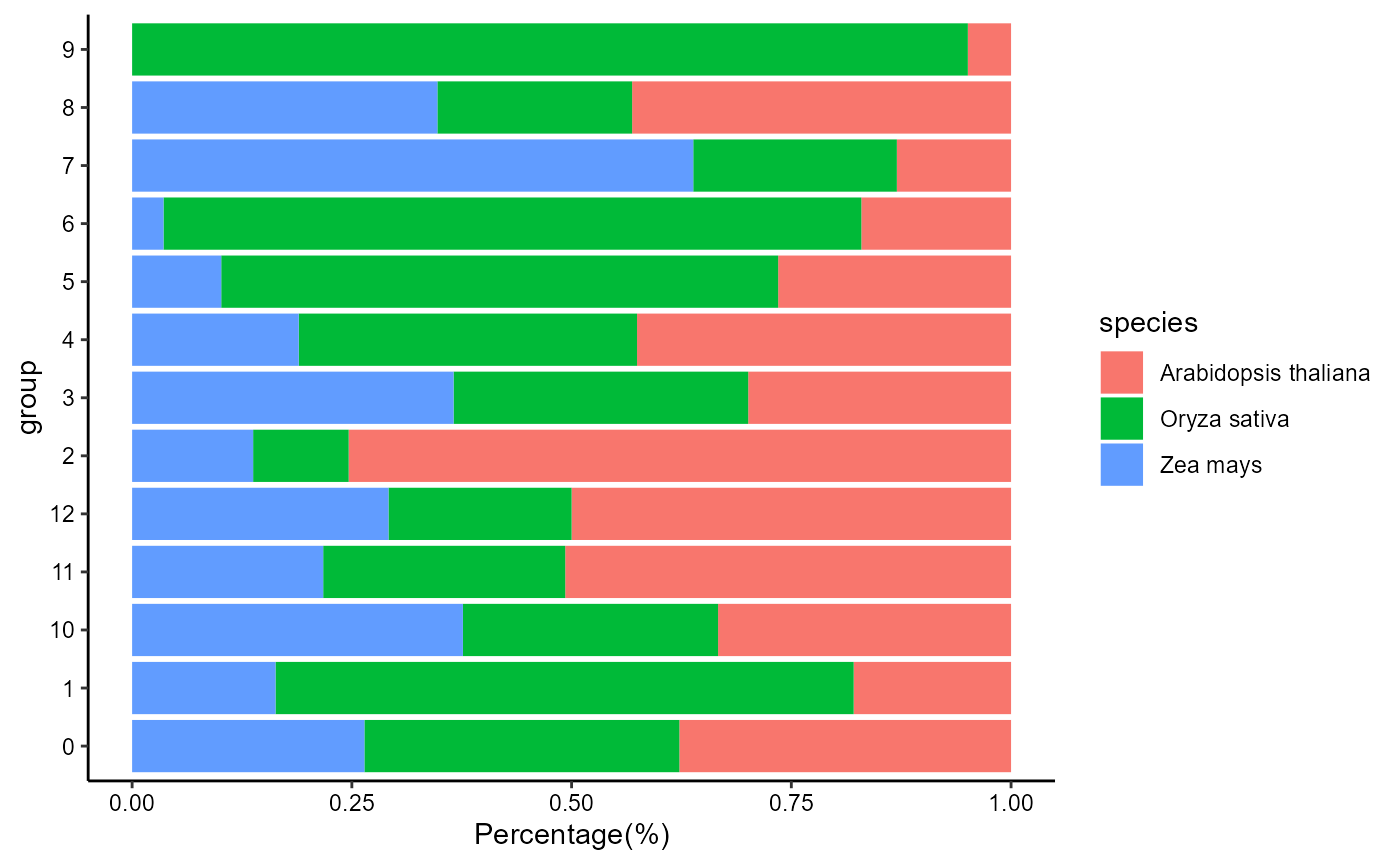
Bar plot showing the percentage of cells from different species:
species_percentage(integratedObj, group_by = 'seurat_clusters')